Introduction
Have you ever found yourself in a situation where you were supposed to troubleshoot a long running expensive query that was hammering your SQL Server? I bet you wanted to get and analyse the actual runtime execution plan of this query.
In this blog post, I will show you how to get the Live Execution Plan for your queries using Extended Events. The blog post will be divided into the following four parts:
-
Part 1: Create an Extended Event that allows you to get the Live Execution Plan
-
Part 2: Start the xEvent and view the Live Execution Plan in Activity Monitor
-
Part 3: Stop and delete the Extended Event Session
-
Part 4: What’s coming next in SQL Server 2019?
Part 1: Create an Extended Event that allows you to get the Live Execution Plan
In the first part, I’ll demonstrate how to create an xEvent that allows you to get the Live Query Plan based on the SQL Server version you are currently running. I’ll briefly describe the following three cases:
Before SQL Server 2014 SP2/2016
Starting with SQL Server 2014, you can enable the Live Query Statistics globally for all sessions by creating and starting the query_post_execution_showplan extended event. This allows you to see the live query execution in the Activity Monitor.
This feature might be very useful, especially in your Dev or Test environment when you are testing your queries frequently, but it should be used carefully (or just be enabled for the minimum required time) in your Prod environment as it can have a significant performance impact.
Create the Extended Event Session:
Now, let’s create a new session named GetLiveQueryPlan with the query_post_execution_showplan event.
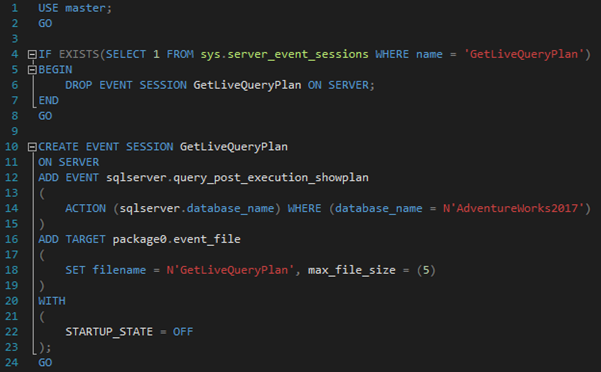
Performance Overhead of query_post_execution_showplan:
As I already mentioned, this event should be used carefully (and preferably in Dev or Test environment) as it can have a significant performance impact. Also, the event’s description in the system dynamic management view sys.dm_xe_objects contains the information about the potential performance overhead.
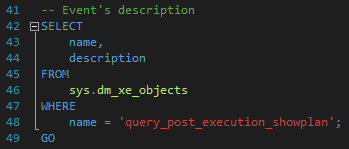
Returned Description:
/*
Occurs after a SQL statement is executed. This event returns an XML representation of the actual query plan. Using this event can have a significant performance overhead so it should only be used when troubleshooting or monitoring specific problems for brief periods of time.
*/
SQL Server 2014 SP2/2016 RTM
With SQL Server 2014 SP2 and SQL Server 2016, MSSQL Tiger Team managed to rapidly improve the performance impact of running this xEvent and they introduced a new extended event called query_thread_profile – this event also allows you to get Live Query Statistics via Activity Monitor.
Create the Extended Event Session:
To create a new Extended Event Session, you can re-use the code from the previous part. Just replace the legacy extended event query_post_execution_showplan with the new extended event named query_thread_profile. The T-SQL script should look like this:
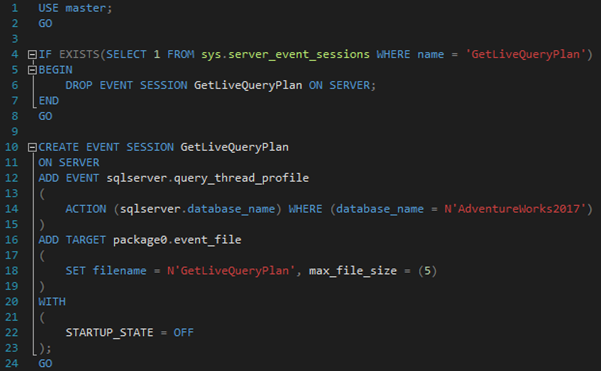
SQL Server 2016 SP1+
With SQL Server 2016 SP1, a new lightweight profiling infrastructure has been introduced. When enabling the extended event query_thread_profile, the new lightweight profiling infrastructure will be used by SQL Server automatically.
According to MSSQL Tiger Team, the CPU overhead when using the new lightweight profiling infrastructure can be between 1.5% up to 2%.
Create the Extended Event Session:
T-SQL script to create a new Extended Event Session query_thread_profile will be identical to the script in the previous example.
Part 2: Start the xEvent and view the Live Execution Plan in Activity Monitor
At this point, we have a new xEvent named GetLiveQueryPlan created (that is using the query_post_execution_showplan or query_thread_profile – based on your SQL Server version), but not yet started.
To start the session, we need to execute the following command:

The GetLiveQueryPlan session should be up and running at this point. To verify this, navigate to “Management” —> “Extended Events” —> “Sessions” and see the status of the GetLiveQueryPlan session:
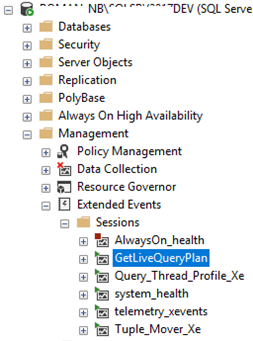
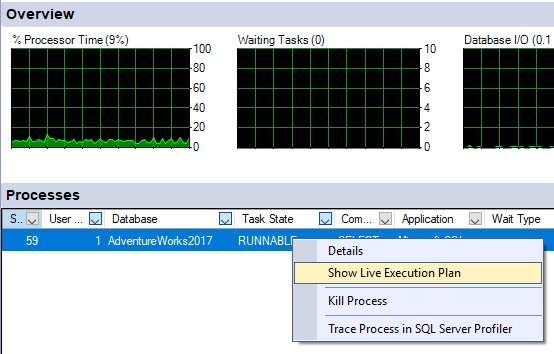
If you launch the Activity Monitor, you should be able to get the Live Execution Plan of running queries – select a required query, right click on it and choose the option “Show Live Execution Plan” from the context menu:
A new window with the Live Query Statistics of the query you selected pops up:
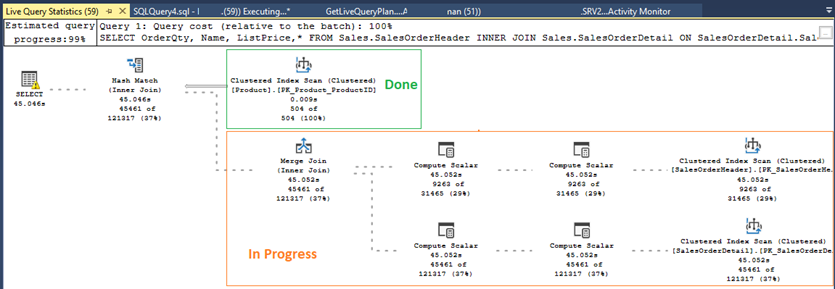
and you also get the actual execution plan once query is finished.
Part 3: Stop and delete the Extended Event Session
When you are done with troubleshooting/monitoring, and you want to stop the running event session, you just either execute the following statement:

or stop the session in the Object Explorer as shown in the screenshot below:
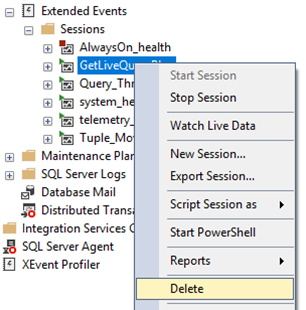
You can obviously start the session again if required in the future. If you want to remove the event session permanently from your SQL Server Instance, you can execute the following query:

or just simply delete it from its context menu:
Part 4: What’s coming next in SQL Server 2019?
In SQL Server 2019, this feature (query_thread_profile and the new lightweight profiling infrastructure) is enabled by default.
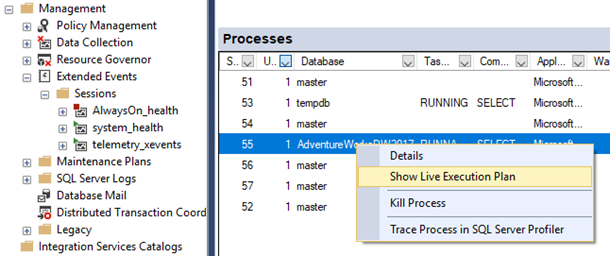
I installed SQL Server 2019 (CTP2.1) – 15.0.1100.94 (X64) in my lab environment and we can see that the option “Show Live Execution Plan” is available in the Activity Monitor by default (without creating any xEvents):
Summary
In this blog post, I explained how to create and start a new Extended Event Session that allows you to get the runtime execution plan of a given query.
I also explained that based on your SQL Server version, you might need to use the query_post_execution_showplan event (versions before SQL Server 2014 SP2/2016) that can have a significant performance impact on your SQL Server and should be used carefully, or the query_thread_profile event that has been introduced in SQL Server 2014 SP2/2016 RTM and improved even more in SQL Server 2016 SP1 where the new lightweight profiling infrastructure is used by SQL Server automatically. The [CPU Overhead %] of each version (Legacy vs. SQL Server 2014 SP2/2016 vs. SQL Server 2016 SP1+) can be found in this blog post written by the MSSQL Tiger Team.
I also demonstrated how to stop and delete an xEvent that is no longer required and in the last part, I described what’s coming next in SQL Server 2019 – you can get the Live Execution Plan automatically (this feature is enabled by default) without creating any xEvents.
Note: The source code I showed you in this blog post is available in my GitHub repository: GetLiveQueryPlan.sql.
Sources
https://blogs.msdn.microsoft.com/sql_server_team/query-progress-anytime-anywhere/
https://blogs.msdn.microsoft.com/sql_server_team/operator-progress-changes-in-lqs/


4 Comments. Leave new
Pretty cool post. Thanks for sharing the scripts, as well.
Thank you, glad you like the blog post.
Greetings from Argentina! Excellent post. I really like when someone explain the same issue on differents SQL SERVER versions. It would be nice if you could paste the tsql code instead of the images of tsql. You know… so other lazy people like me can just copy-paste… 😉
Hello Jair,
thanks for your comment 😉 The source code related to this blog post is available on GitHub: https://github.com/RomanPijacek/ExtendedEvents/blob/master/Get_Live_Execution_Plan/GetLiveQueryPlan.sql
Thank you and have a great day.
Roman