Introduction
I recently got a call from our DBA telling me that the CPU usage is hitting 100% on the DB server and the ETL process runs for more than 24 hours, but still has not finished. You know that feeling, right?
So, I connected to the box and checked out what’s going on using the Activity Monitor tool (unfortunately the sp_WhoIsActive procedure was not available on that specific instance).
In the Activity Monitor, under the Active Expensive Queries, I was able to identify the process that was running for ~ 24hrs and hammering the CPU. The process itself was not being blocked, nor waiting for other processes. The only wait type I observed was the CXCONSUMER which is typical when a parallel process runs.
Performance Tuning: Using Filtered Statistics
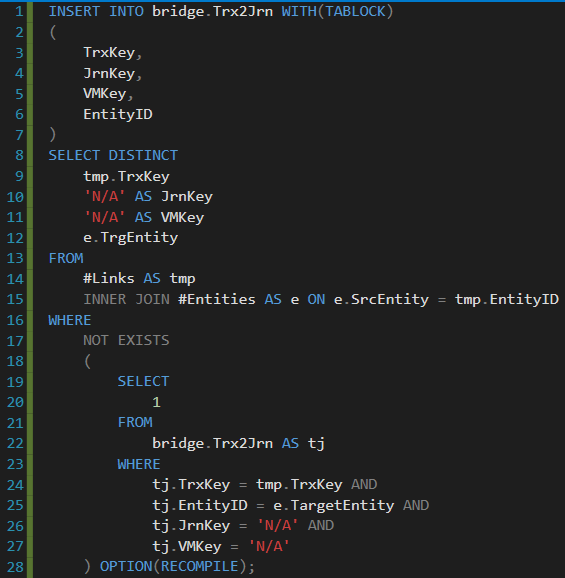
From the Activity Monitor, I knew the exact procedure name and query that was causing this whole performance issue – see the query below (Note: I had to anonymize the object/column names):

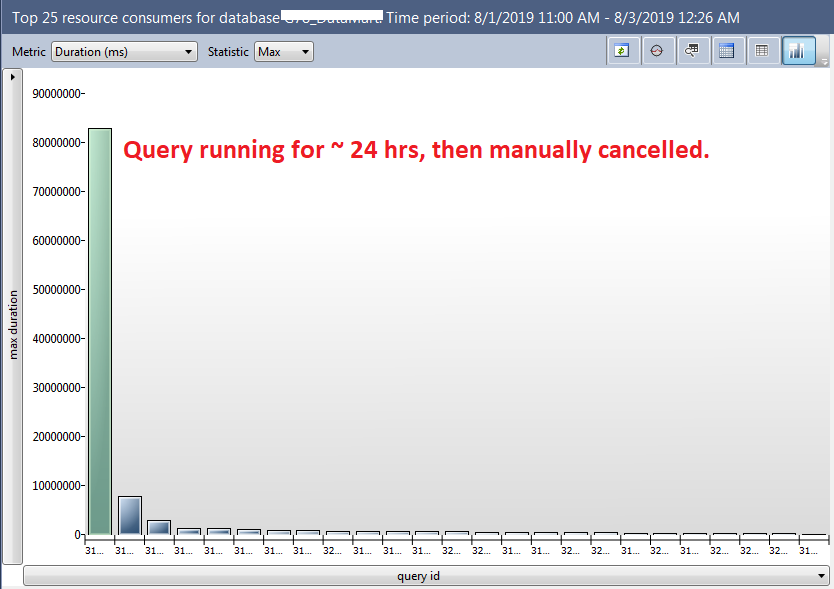
In the Query Store, I double checked the query Duration(ms). Other expensive queries looked like peanuts compared to this one:

I also got the execution plan of a given query:

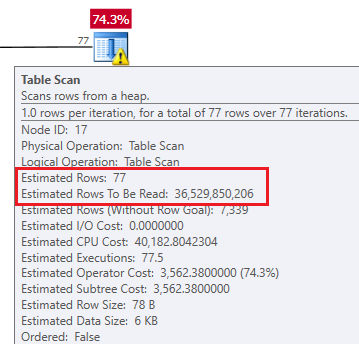
Below are the estimates for the bridge table scan (the one that costs 74.3%):

Based on the execution plan, I realized that the optimizer chose to perform the Nested Loop (Left Anti Semi Join) operator (in the red square). That’s not the join type I would expect to see in the execution plan. The bridge table (in the bottom part of the execution plan) contains hundreds of millions of rows and there were also a couple of million rows in the temp tables (the upper part of the execution plan). That’s why I would expect to see the Hash Match join operator instead.
My first idea was to update the statistics (with FULL SCAN) on the bridge table and check the execution plan again. No luck, optimizer still preferred the Nested Loop join type. I was also thinking about adding a new covering index on the bridge table, but this was a “no go” for me at that specific time, as the application created/dropped indexes on this table automatically and I was not sure how it will impact the minimal logging and the insert statement execution time.
I reviewed the query again, especially the NOT EXIST part and realized that in the WHERE clause of this subquery, we use the following 4 columns: tj.TrxKey, tj.EntityID, tj.JrnKey, tj.VMKey. The last two columns (tj.JrnKey, tj.VMKey) are always being compared to the string ‘N/A’.
My next step was to manually create filtered statistics on the bridge table. Compared to the index creation, this process is very lightweight and doesn’t require that many resources. The source code I executed is shown below:

The execution plan looked much better after I created the filtered statistics. Finally, the estimates were much more accurate, and the optimizer decided to use the Hash Match (Left Anti Semi Join) operator. See the new estimated execution plan below:

Then, I re-ran the ETL job and that specific query finished in a couple of minutes without any issues. Yes, that’s right, a couple of minutes.
Conclusion
No doubt filtered statistics can be extremely useful and can rapidly improve the performance of your query. In some specific scenarios, you might not be allowed to create/drop indexes or change the source code of the application, so filtered statistics can be the right choice.
Do you have any interesting scenarios where filtered statistics helped you to improve performance? Please share your thoughts in the comments below.
Sources
To understand the filtered statistics basics, I would recommend you check out the following blog post written by Pinal Dave. Also, if you want to dive deeper into the skewed data and filtered statistics topic, I would strongly recommend you read this blog post written by Susantha Bathige.


