

What is this about
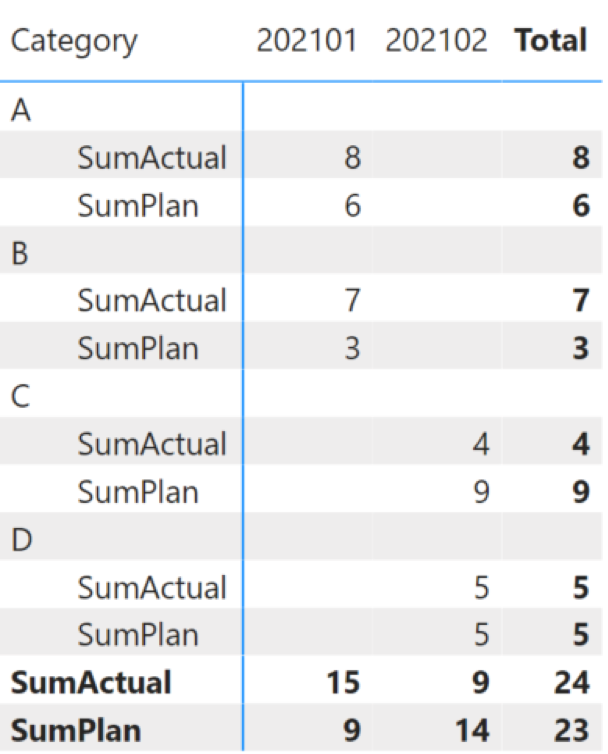
There are a lot of situations you can meet while working with PowerBI. One of these situations is that you need to have your measures in rows (not in columns as default). See. picture below.
How to do that
I suppose you have prepared data sources and created model in PowerBI.
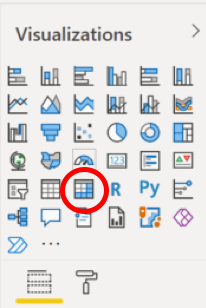
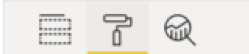
Choose matrix in PowerBI desktop.
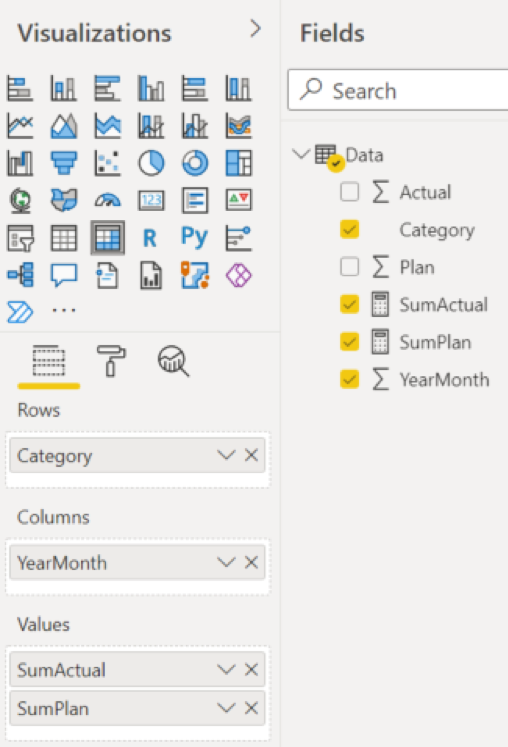
Next step is to create measures and insert the fields into the matrix.
When you do the step before, you get the following output:
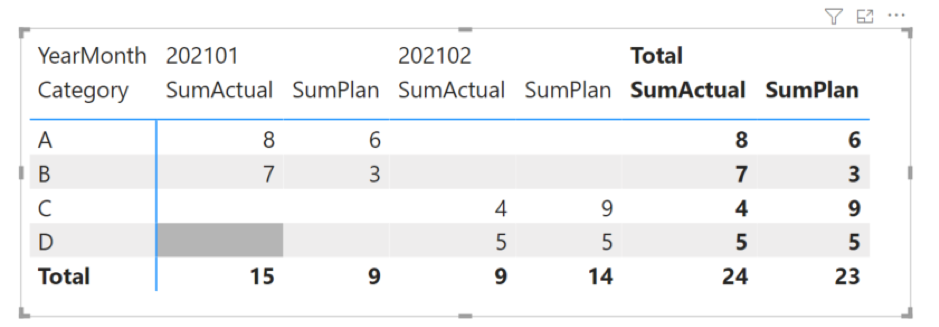
But you want to have measures in rows not to columns. So, go to the “Format pane”.
Go to the values.
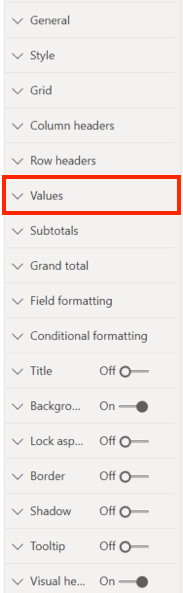
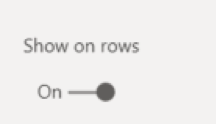
And enable “Show on rows”.
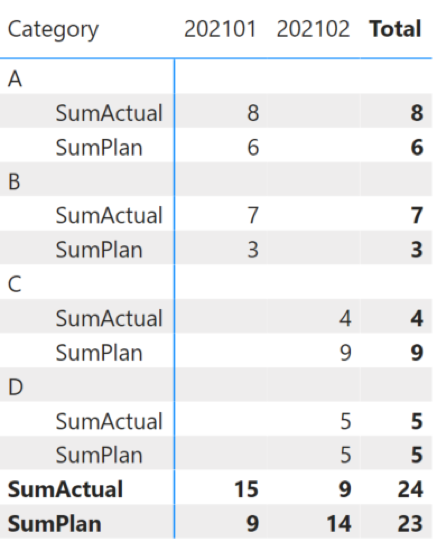
After this step you will have your wished visual.

I have been dealing with MS SQL Server for several years. I enjoy both scripting and server administration. Joyful Craftsmen allowed me to deepen my knowledge on cloud solutions as well. That’s why I’m happy to share with you what I’ve learned about migrating data to Azure.


2 Comments. Leave new
Perfect, solved all my problems! Thanks a lot!
Thank you for this article, helps me a whole lot!
Best Regards,